Appearance
Matplotlib 学习笔记
Matplotlib绘图
python
from jupyterthemes import jtplot

jtplot.style(theme='monokai')  # 选择一个绘图主题

import matplotlib.pyplot as plt
# 个别环境需要以下代码
%matplotlib
inline
python
plt.figure()
plt.plot([1, 0, 9], [4, 5, 6])
plt.show()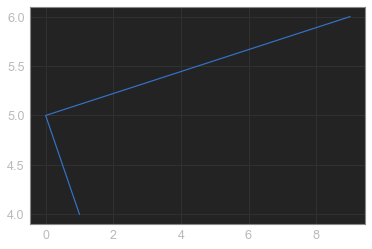
折线图绘制与显示
python
# 展现一周天气
# 1.创建画布
plt.figure(figsize=(20, 8))
# plt.figure(figsize=(),dpi=)
# figsize:指定图的长宽
# dpi:图像清晰度
# 返回fig对象

# 2.绘制图像
plt.plot([1, 2, 3, 4, 5, 6, 7], [17, 17, 18, 15, 11, 11, 13], label="hh")
# plt.plot(x,y,color=,linestyle=",label=")
# figure, axes = plt.subplots(nrows=1, ncols=2, figsize=(20,8), dpi=80)

# 显示图例
plt.legend(loc="lower left")

# 添加网格显示
plt.grid(True, linestyle='-', alpha=0.5)

# 3.保存图像 必须放在show的前边,因为show会释放图像资源
# plt.savefig("test.png")

# 4.显示图像
plt.show()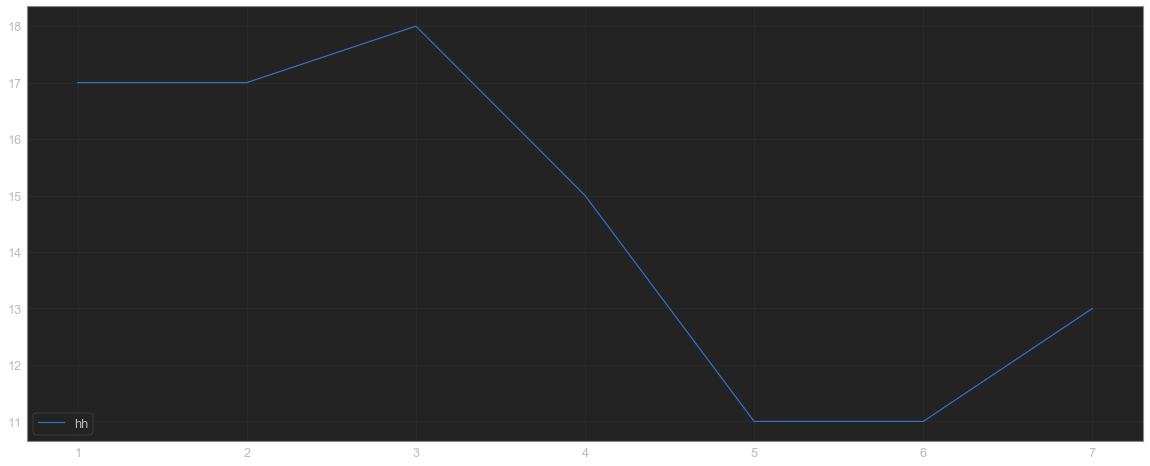
绘制数学函数图像
python
import numpy as np

# 1.准备x,y数据
x = np.linspace(-1, 1, 1000)
y = 2 * x * x

# 2.创建画布
plt.figure(figsize=(20, 8), dpi=80)

# 3.绘制图像
plt.plot(x, y)

# 4.显示图像
plt.show()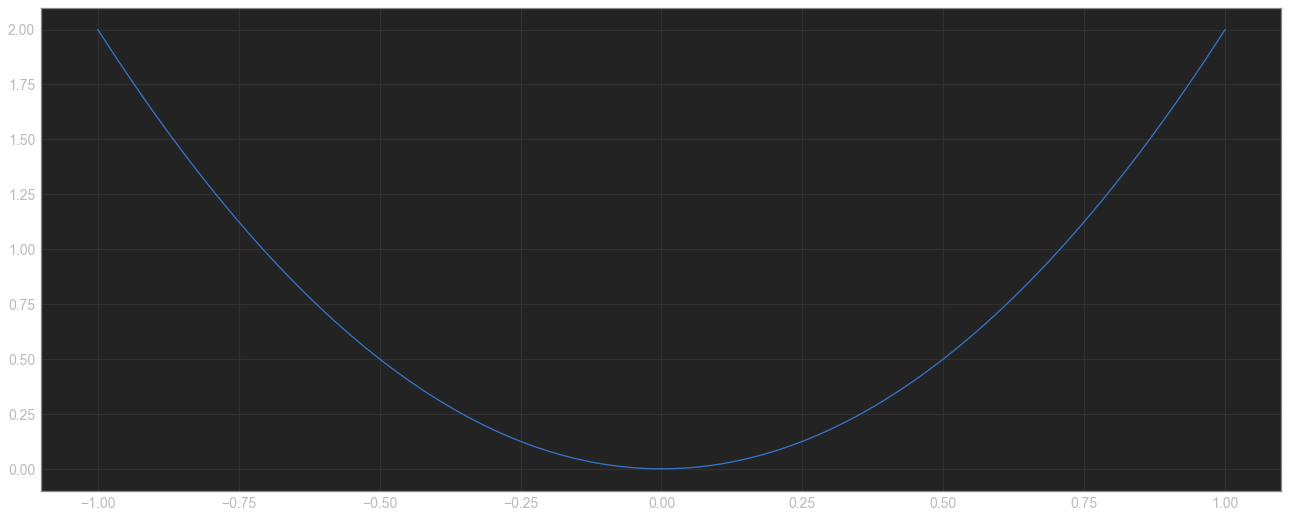
散点图绘制
python
# 1.准备数据
x, y = [1, 2, 3, 4, 5, 6, 7], [17, 17, 18, 15, 11, 11, 13]
# 2.创建画布
plt.figure(figsize=(20, 8))
# 3.绘制图像
plt.scatter(x, y)
# 4.显示图像
plt.show()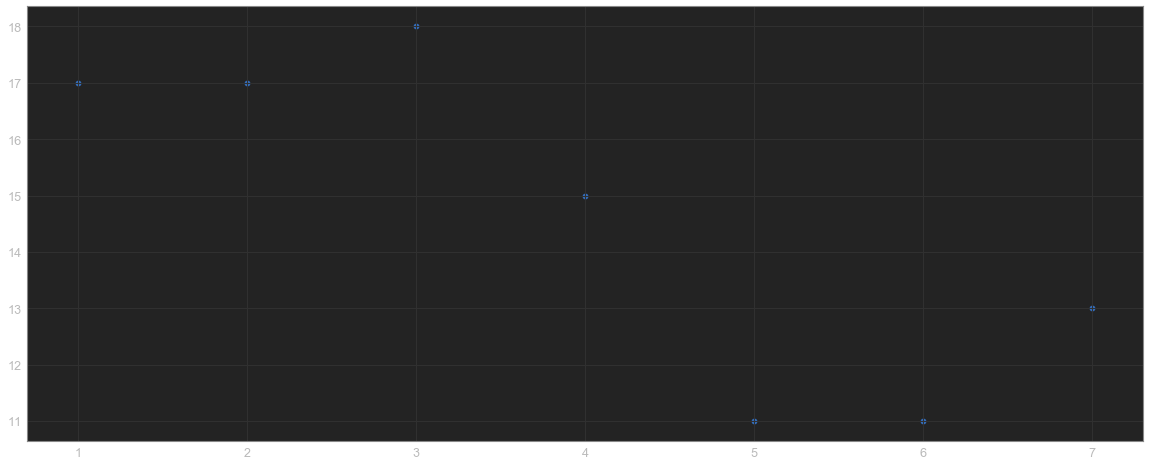
绘制柱状图
python
# 1.准备数据
x, y = [1, 2, 3, 4, 5, 6, 7], [17, 17, 2, 15, 11, 11, 13]
# 2.创建画布
plt.figure(figsize=(20, 8))
# 3.绘制图像
plt.bar(x, y, width=0.5, color=['r', 'b', 'y', 'g'])
# 4.显示图像
plt.show()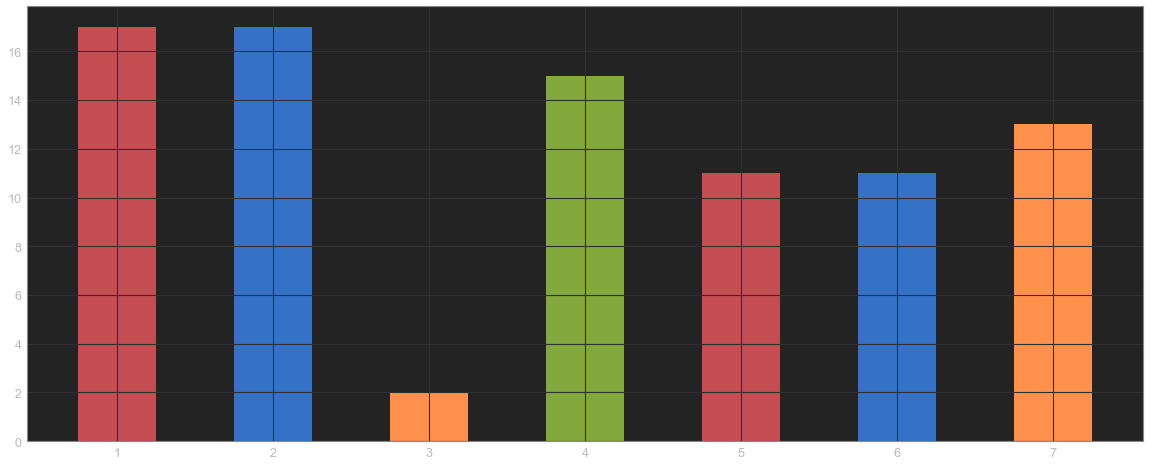
绘制直方图
python
x = [1, 2, 3, 4, 5, 6, 17, 17, 18, 15, 11, 45, 12, 54, 23, 45, 6, 12, 87, 51, 11, 13]

plt.figure(figsize=(20, 8), dpi=80)

distance = 2
group_num = int((max(x) - min(x)) / distance)

plt.hist(x, bins=group_num)

plt.show()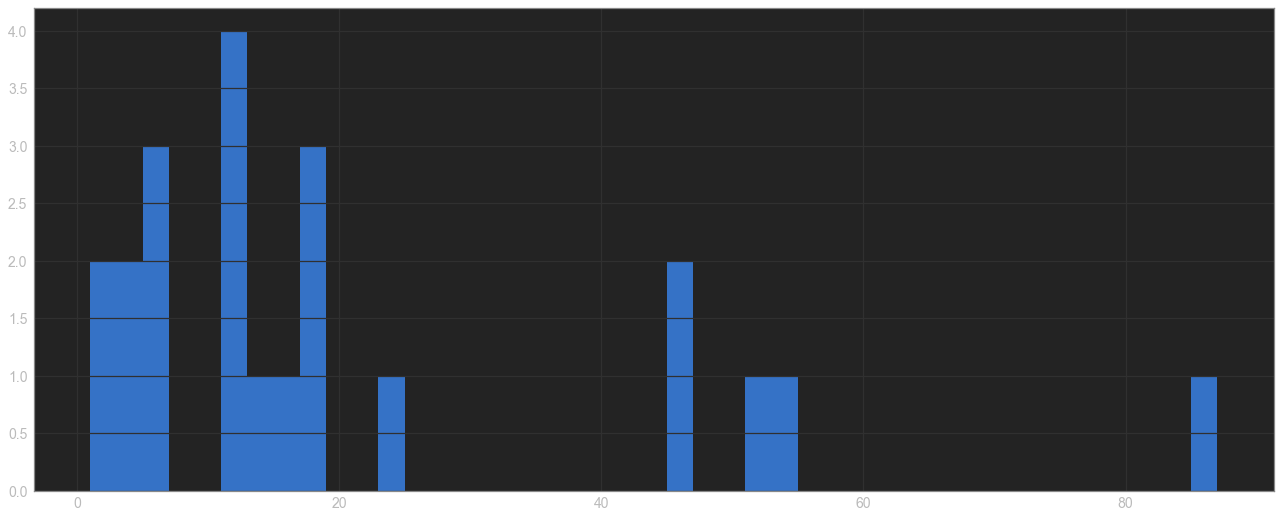
饼图
python
# 1.准备数据
x, y = [1, 2, 3, 4, 5, 6, 7], ['17', '17', '2', '15', '11', '11', '13']
# 2.创建画布
plt.figure(figsize=(20, 8))
# 3.绘制图像
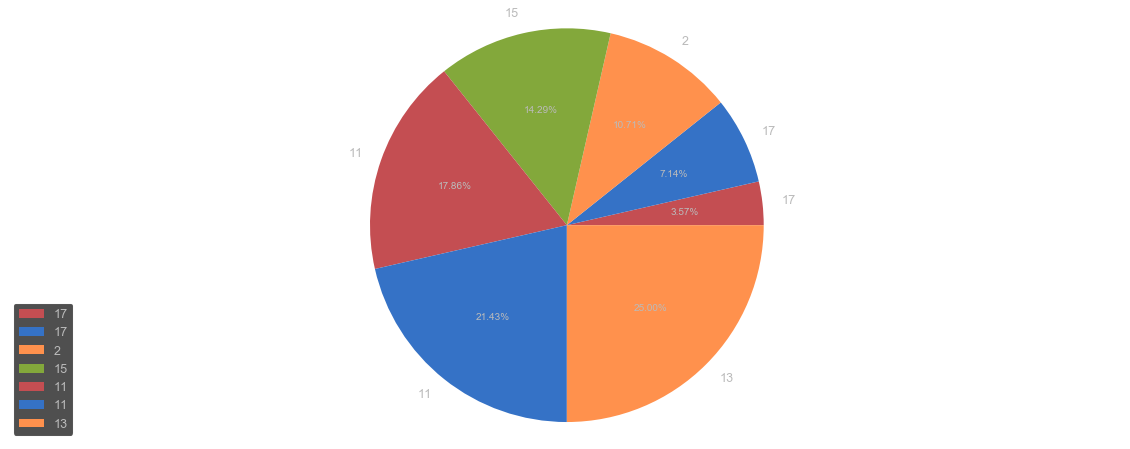
plt.pie(x, labels=y, autopct='%1.2f%%', colors=['r', 'b', 'y', 'g'])
# x,y轴刻度等长
plt.axis('equal')
plt.legend(loc="lower left")
# 4.显示图像
plt.show()